I still remember walking into a food‑packaging plant where compressed air was treated like free electricity: hoses left blowing, valves leaking, and large blow‑off devices used for product drying. The plant’s energy bill told one story, but nobody could point to which machines, lines, or shifts were truly driving the cost. That’s the problem zero‑touch energy audits aim to solve — and edge telemetry makes them practical and scalable for compressed‑air systems.
Why compressed air matters (and why it’s hard to measure)
Compressed air is often one of the largest and most wasteful energy users in manufacturing. It’s also invisible: leaks, inappropriate uses (like using air for cooling or cleaning), and part‑level inefficiencies compound into big bills. Traditional audits require a lot of manual walking, temporary dataloggers, and operator interviews. They produce useful insights, but they’re labor intensive and quickly stale.
What I look for in a better approach is three things: low disruption, automated and continuous data collection, and the ability to attribute consumption back to specific machines or processes. Edge telemetry delivers on all three.
What is zero‑touch energy auditing with edge telemetry?
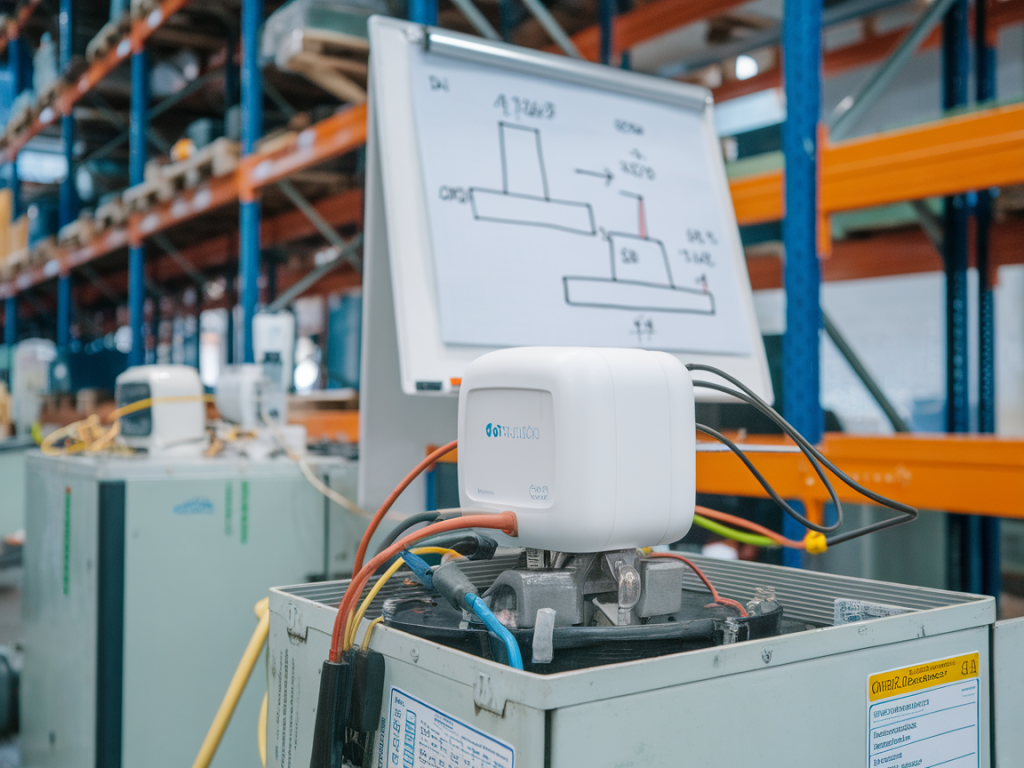
In plain terms, zero‑touch energy auditing uses fixed sensors and edge devices to continuously monitor compressed‑air pressure, flow, and electrical consumption at strategic points without needing prolonged manual data collection. "Zero‑touch" isn’t literally no human contact; it means minimal operational disruption and no repeated manual logging. Once installed, the system collects and pre‑processes data at the edge, then sends summarized telemetry to cloud analytics or an on‑premises historian for attribution and alerts.
Key components of a practical deployment
How attribution actually works
People often ask: how can you say "Machine X used Y kWh of compressed air"? The short answer is correlation plus causation via modeling and event alignment.
Here’s the methodology I use:
Common questions I get
Q: Do I need to instrument every machine?
A: No. You should start with a hybrid approach: fully instrument one or two critical lines, then add branch/zone meters to cover groups of machines. Use PLC/MES signals to resolve which machine in a zone is active. Full per‑machine sensors are ideal but often unnecessary and expensive.
Q: How accurate is this without per‑machine flow meters?
A: Accuracy depends on how well you can correlate events and the topology. For many use cases, you can achieve 80–95% accuracy for major machines after a short calibration period. Small sporadic uses (hand tools, intermittent leaks) are harder to attribute precisely but can still be detected as anomalies or unallocated consumption.
Q: What about latency and data volume?
A: Edge telemetry mitigates both. By performing event detection and pre‑aggregation on the gateway, you send only relevant summaries (e.g., cycles per hour, max/min pressure, attributed kWh) to the cloud. This reduces bandwidth and speeds up alerting.
Practical metrics and KPIs to track
Quick implementation checklist
Real results I’ve seen
In one case with an electronics assembly plant, the system identified a small drying oven using compressed air continuously during night shifts because its automatic valve failed to close. Attribution showed the oven accounted for 12% of plant compressed‑air energy. Fixing the valve and adding shutdown logic saved 8% on the plant’s total energy bill within weeks — with less than three days of onsite installation and a month of telemetry.
Pitfalls and what to watch for
Tools and vendors I recommend considering
If you want off‑the‑shelf options, companies like Airmaster (for flow metering), SMC (for industrial sensors), and Schneider/Siemens for edge gateways provide solid building blocks. For analytics, think about platforms that support time‑series data and custom models: AWS IoT, Azure IoT, or smaller stacks like InfluxDB with Kapacitor for edge rules.
By combining practical topology knowledge, a few well‑placed sensors, and lightweight edge analytics, zero‑touch energy audits unlock precise, continuous visibility into compressed‑air use. That visibility is the foundation for targeted fixes, sustained savings, and a cultural shift toward treating compressed air as the valuable utility it really is.