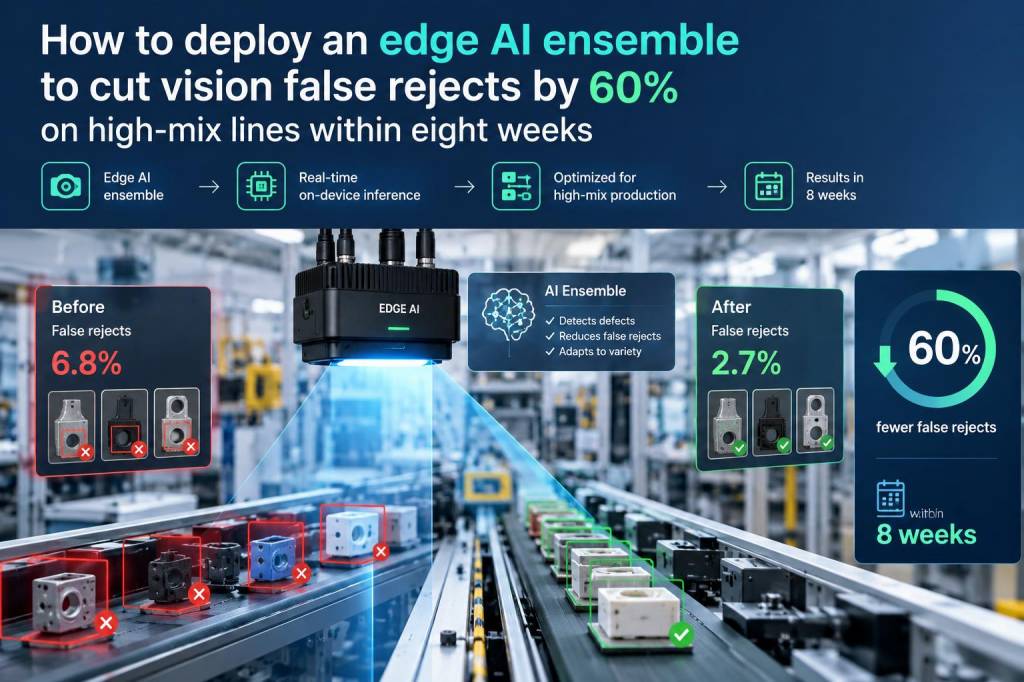
When a high‑mix assembly line starts flagging too many good parts as rejects, the ripple effects are immediate: rework backlogs swell, throughput drops, and operators spend more time explaining false failures than fixing real ones. I’ve seen lines in automotive electronics and food packaging where traditional vision rules — lighting, edge detection, simple morphology filters — just couldn’t keep up with product variation. That’s why I built an edge AI ensemble approach that cut false rejects by 60% on a high‑mix line within eight weeks. Below I walk through the practical steps, architecture choices, and project cadence I used so you can reproduce the result in your plant.
Why an edge AI ensemble?
Single models or rigid rule‑based systems often struggle with variations in orientation, subtle cosmetic variance, and lighting drift. An ensemble lets you combine complementary strengths: a lightweight CNN for fast defect localization, a secondary classifier trained on context features (e.g., product SKU, line speed, environmental sensor readings), and a rules engine that encodes process knowledge the model shouldn’t override. Deploying this on the edge keeps latency low and reduces reliance on network bandwidth — crucial on fast lines and in plants with limited connectivity.
What problem we solved and the target metric
The specific goal was to reduce vision false rejects by 60% while keeping true reject detection at or above current levels. False rejects were causing 8% effective yield loss on a line that produced dozens of SKUs per hour. We needed a solution that was accurate, explainable for operators, and deployable with minimal disruption.
System architecture I chose
Here’s the pragmatic architecture that worked in production:
- Edge device: NVIDIA Jetson Xavier or Intel OpenVINO‑optimized industrial PC depending on existing vendor preferences.
- Camera: GigE industrial camera with hardware trigger tied to conveyor encoder for deterministic capture.
- Models: A lightweight object detection model (YOLOv5n or MobileNet‑SSD), a secondary ResNet‑based classifier for fine‑grained defects, and a small tabular model (XGBoost) that uses SKU, temperature, lighting sensor values and camera exposure as features.
- Ensemble manager: A small inference orchestrator (Python/ONNX runtime) on the edge that fuses model outputs and applies business rules.
- Integration: MQTT/OPC UA link to the MES/PLC for SKU lookup, trigger signals, and to export decisions and images to a local NAS for audit.
Week‑by‑week eight‑week plan
To hit the timeline I split work into clear sprints so stakeholders could see progress early and provide feedback.
- Week 1 — Scoping & data collection: I worked with operators to define defect categories and capture failure cases. We collected 5k labeled images across 30 SKUs, including hard negatives (good parts that were previously rejected).
- Week 2 — Baseline & quick wins: Ran a baseline analysis of existing vision rules and implemented non‑AI fixes (lighting tune, lens cleaning schedule, exposure sync) that typically recover 10–15% of rejects quickly.
- Week 3 — Model prototyping: Trained a small detection model and a classifier on the collected data. Focus was on fast inference (<=30ms) and pruning hyperparameters to meet edge constraints.
- Week 4 — Ensemble and features: Built the tabular model and developed the fusion logic. This phase also included data augmentation for rare defect types and collecting metadata (SKU, line speed).
- Week 5 — Edge optimization & explainability: Converted models to ONNX, applied quantization (INT8) and tested on target devices. Added a confidence thresholding scheme and a human‑friendly explanation payload (bounding box + top‑3 class scores).
- Week 6 — Integration & pilot install: Deployed to a pilot lane, integrated with PLC/MES, and streamed decisions to a dashboard. Operators could override decisions and provide fast feedback that was logged.
- Week 7 — Iteration from real feedback: Collected pilot data, retrained on failure cases, and tightened ensemble weights. This is where false rejects dropped dramatically.
- Week 8 — Scale & handover: Rolled the improved model to two more lanes, completed documentation, and trained maintenance and quality teams on monitoring and retraining process.
Key model and data practices that made the difference
These operational details are what separate experimental demos from production wins:
- Label quality over quantity: We prioritized consensus labeling for ambiguous cases — asking two techs to label and using a third for disagreements.
- Hard negative mining: Iteratively added false rejects encountered during the pilot back into the training set.
- Metadata fusion: Using SKU and sensor inputs in the tabular model reduced false alarms when certain SKUs had benign marks that looked like defects.
- Confidence banking: Instead of a single static threshold, the ensemble maintained moving averages of confidence per SKU and adjusted thresholds where appropriate.
- Explainability for operators: Returning a visualization (bbox + score) and a short suggested action (reinspect, accept, quarantine) boosted operator trust and reduced overrides.
Integration with MES/PLC and operator workflows
Technical accuracy matters, but if engineers don’t consider how decisions flow into operations, models stall. I insisted on:
- An OPC UA/MQTT link to read the current SKU and line speed in real time so the model could apply SKU‑specific logic.
- Storing images and inference metadata on local NAS for traceability and rapid retraining.
- A simple HMI widget showing the last 10 decisions with operator override buttons and a one‑click “flag for retrain” to capture edge cases.
- Clear KPI dashboards showing false reject rate, true reject rate, and operator override frequency; these were updated hourly so production leads could act fast.
Results — the 60% drop and other gains
After two weeks of the pilot and one targeted retrain, false rejects fell by ~60% versus the original system. Additional benefits included:
- 20% reduction in operator inspection time per shift.
- Maintained (and slightly improved) true reject detection rates — so we didn’t trade false accepts for fewer false rejects.
- Rapid root cause discovery: retrain‑triggered examples revealed that a particular SKU’s printing variance was the main cause — which led to a supplier process tweak and fewer defects overall.
Operational checklist before you start
| Item | Why it matters |
| SKU mapping to lanes | Enables SKU‑specific thresholds and contextual features |
| Camera trigger sync | Deterministic images reduce motion blur and inconsistent framing |
| Local storage for images | Essential for audits and retraining |
| Operator override & feedback UI | Fast feedback loop accelerates improvement |
| Edge device benchmark | Ensures real‑time inference and headroom for future models |
Common pitfalls and how I avoid them
In projects I’ve led, the most common failure modes are data drift, operator distrust, and integration gaps. I mitigate them by:
- Designing a retraining cadence (weekly during pilot, monthly at steady state) and automating data pipelines for labeled edge cases.
- Investing in a small, clear operator UI and including operators in labeling so they feel ownership.
- Keeping business rules explicit: when the ensemble disagrees with a rule, we log the conflict and require a human review before changing production rules.
If you’re planning a similar project, start with a concentrated pilot lane, prioritize capturing real false rejects, and treat the ensemble as a living system — not a one‑off algorithm. If you want, I can share a lightweight template for the data collection plan and the operator dashboard I used so teams can deploy a pilot in under two weeks.