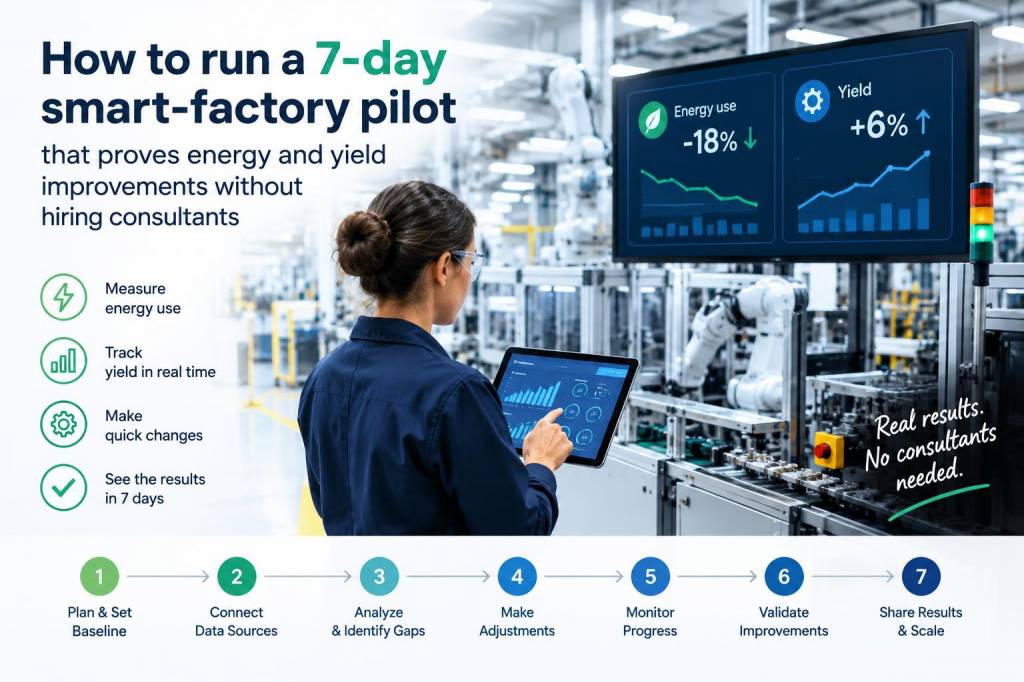
I’m going to walk you through a practical, seven‑day smart‑factory pilot designed to prove measurable energy and yield improvements using only on‑site people and low‑cost tools — no outside consultants required. This is the rapid, outcome‑oriented approach I’ve used in multiple plants: focused instrumentation, clear KPIs, a tight experiment plan, and simple analytics that deliver an answer you can act on.
What this pilot proves (and what it does not)
The pilot is built to answer two concrete questions within seven days:
- Energy: Can we reduce specific energy consumption (kWh per unit produced) by at least 5–10% through operational changes and simple control tweaks?
- Yield: Can we increase first‑pass yield (FPY) or reduce reject rate by at least 5% through targeted parameter adjustments and process monitoring?
This pilot does not attempt to deliver plantwide MES or full digital twin deployments. It’s a focused experiment — the goal is an evidence‑based decision: scale a solution, iterate, or stop.
Why seven days?
Seven days is short enough to keep attention and resources aligned, and long enough to capture repeatable production cycles, shift changes, and initial seasonal or batch variability. It forces a hypothesis‑driven, minimally viable instrumentation approach that yields actionable data fast.
Who you need on the team
- Process champion (1): A production engineer or lead operator who knows the process and can make controlled parameter changes.
- Data lead (1): An automation or IT person comfortable with basic data collection (PLC tags, MQTT, simple scripts) and spreadsheet analysis.
- Operator(s) (2–3): Frontline operators to run the trials and note anomalies; they own adherence to the protocol.
- Optional: Energy lead (1): If you have a facilities engineer, include them for power metering setup and interpretation.
These roles can be part‑time — the pilot requires roughly 2–4 hours/day from each role during the week, and a 1–2 hour daily sync.
Minimum technical stack
You don’t need fancy platforms. Use what’s reliable and available:
- Data capture: PLC tags, OPC UA or simple Modbus/serial reads. If PLC access is limited, use clamp meters or a smart meter (e.g., Sense, Shelly, or industrial meters with Modbus/TCP).
- Edge collector: Raspberry Pi or any small PC running Node‑RED, Telegraf, or a Python script to collect and forward data via MQTT or HTTP.
- Storage & dashboard: InfluxDB + Grafana, or a simple CSV/Excel file for small datasets. For near‑real‑time dashboards, Grafana is quick to set up.
- Analysis: Python (pandas) or Excel. Use simple statistical tests (t‑test) and visual control charts.
Key metrics to capture
| Metric | Why it matters | Target |
|---|---|---|
| kWh per unit | Direct measure of energy efficiency | ↓ 5–10% |
| Total kWh (per shift) | Detects baseline shifts or unusual events | — |
| Units produced | Denominator for energy and yield | — |
| First Pass Yield (FPY) | Primary quality metric | ↑ 5%+ |
| Cyle time / takt time | Checks for throughput impact | No degradation >2–3% |
| Process parameters (temps, pressures, setpoints) | Correlate with yield/energy | — |
Day‑by‑day plan
Below is a practical schedule you can follow. Each day includes what to measure, who does it, and the expected output.
Day 0 (pre‑pilot): Prepare — half day
- Install meters and collectors. Validate tag names and timestamps.
- Agree KPIs, data frequency (1s–1min for process tags, 1–5min for power).
- Define safe parameter bounds and the approval process for changes.
- Create a simple dashboard showing kWh per unit, FPY, and cycle time.
Day 1: Baseline capture
- Run normal production. Collect full‑shift baseline for metrics.
- Operators keep a log of interventions, rejects, and incidents.
- Output: Baseline report (CSV + dashboard visuals).
Day 2: Hypothesis & small tests
- Define 2–3 hypotheses. Examples: lower heater setpoint by 2°C reduces energy without affecting yield; slightly slower conveyor speed improves FPY.
- Run controlled A/B tests within the shift (alternate batches or lines).
- Keep tests short and isolated to avoid confounding variables.
Day 3: Repeatability & parameter sweep
- Repeat promising tests. For a parameter sweep, change in small increments and log results.
- Use control charts to check if observed changes exceed normal variation.
Day 4: Root cause & cross‑check
- Correlate yield defects to process parameters and energy spikes. Use simple regression or scatter plots.
- If energy improvements correlate with product quality degradation, revert and try alternate interventions.
Day 5: Consolidation run
- Apply the best set of changes for a full shift. Measure energy per unit and FPY.
- Document operator experience: any manual workarounds, alarms, or exceptions.
Day 6: Robustness & shift variability
- Run the consolidated settings across multiple shifts or different operators to test robustness.
- Capture environmental factors if relevant (ambient temperature, raw material batch).
Day 7: Final analysis & decision gate
- Run statistical comparison: baseline vs. treatment for energy per unit and FPY (paired t‑test or non‑parametric equivalent).
- Prepare a one‑page decision memo: results, recommended next steps (scale, iterate, or stop), estimated ROI, and required CAPEX for scaling.
Quick analytics recipes
Here are simple analyses I use to get robust answers fast:
- kWh per unit: aggregate energy over the period / units produced. Plot daily distributions and compute mean ± CI.
- FPY lift significance: compare defect counts using a two‑proportion z‑test or Fisher’s exact test for small samples.
- Control charts: use an X‑bar and R chart for cycle time and kWh per unit to spot special cause variation.
- Correlation check: Pearson or Spearman between process parameter and defect rate. Treat correlation as hypothesis generator, not proof.
Risk management and guardrails
- Never change setpoints outside pre‑agreed safety bounds. Have a rollback plan and operator sign‑off.
- Document every change in a simple log — who, what, why, and time.
- Stop the trial if product safety or customer quality is at risk.
Common pitfalls and how to avoid them
- Pitfall: Small sample size. Fix: Repeat tests and run consolidation shifts to gather enough data.
- Pitfall: Confounding changes (maintenance, material change). Fix: Coordinate calendar with maintenance and procurement teams to avoid overlaps.
- Pitfall: Over‑engineering the stack. Fix: Start with CSV + Grafana or Excel. Only introduce databases if data volume requires it.
When to scale
Scale when the pilot delivers statistically significant energy or yield improvement and the solution is operationally robust across shifts. Prepare a short business case with estimated annual energy savings, reduced scrap costs, implementation effort, and payback period. Include training needs and automation changes (PLC logic, setpoint templates, supervisory dashboards).
Run this seven‑day pilot with disciplined execution and you’ll have a clear, evidence‑based answer: a repeatable operational change that delivers measurable savings — or a fast way to rule out an idea and move on. The biggest advantages come from focusing on data, tight hypotheses, and involving the people who run the process every day.