practical guide to deploying predictive maintenance on servo motors with vibration + current signatures

practical guide to deploying predictive maintenance on servo motors with vibration + current signatures

I remember the first time I watched a servo drive fail mid-shift: a sudden torque oscillation, a production stop, and a frantic scramble to diagnose a machine that looked fine on paper. That experience shaped how I approach predictive maintenance for servo motors. In this article I’ll walk you through a practical, hands-on approach to deploying a predictive maintenance system that combines vibration and current signature analysis — a pairing that gives you a clearer window into mechanical and electrical health than either signal alone.

Why combine vibration and current signatures?

Vibration tells you about mechanical problems — bearing wear, imbalance, misalignment, gear defects. Current signature analysis (CSA) detects electrical and electromechanical faults — winding issues, rotor bar defects, load anomalies, and even changes in friction that affect motor torque. Used together, they increase diagnostic coverage and reduce false positives.

From my deployments, vibration alone sometimes flags “anomaly” without telling you whether it’s electrical resonance or a true bearing defect. CSA can disambiguate those cases. Conversely, CSA can miss early bearing degradation if the electrical load hasn’t changed enough — vibration picks that up. The combination leads to earlier, more actionable alerts.

Key components of a practical system

  • Sensors: accelerometers for vibration (tri-axial preferred), and current sensors (split-core CTs, Rogowski coils, or Hall-effect sensors depending on bandwidth and installation limits).
  • Edge hardware: an industrial gateway or PLC with sufficient sampling rate and on-device preprocessing (e.g., 10–20 kHz for vibration, 2–10 kHz for current depending on harmonic detection needs).
  • Software: signal processing + feature extraction, a lightweight anomaly detection model on the edge, and a backend for data storage, visualization, and orchestration.
  • Connectivity: secure MQTT/OPC UA for telemetry; local fallback for intermittent networks.
  • Processes and KPIs: defined alarm thresholds, maintenance workflows, and metrics like MTBF, false positive rate, and time-to-action.
  • Sensor selection and placement

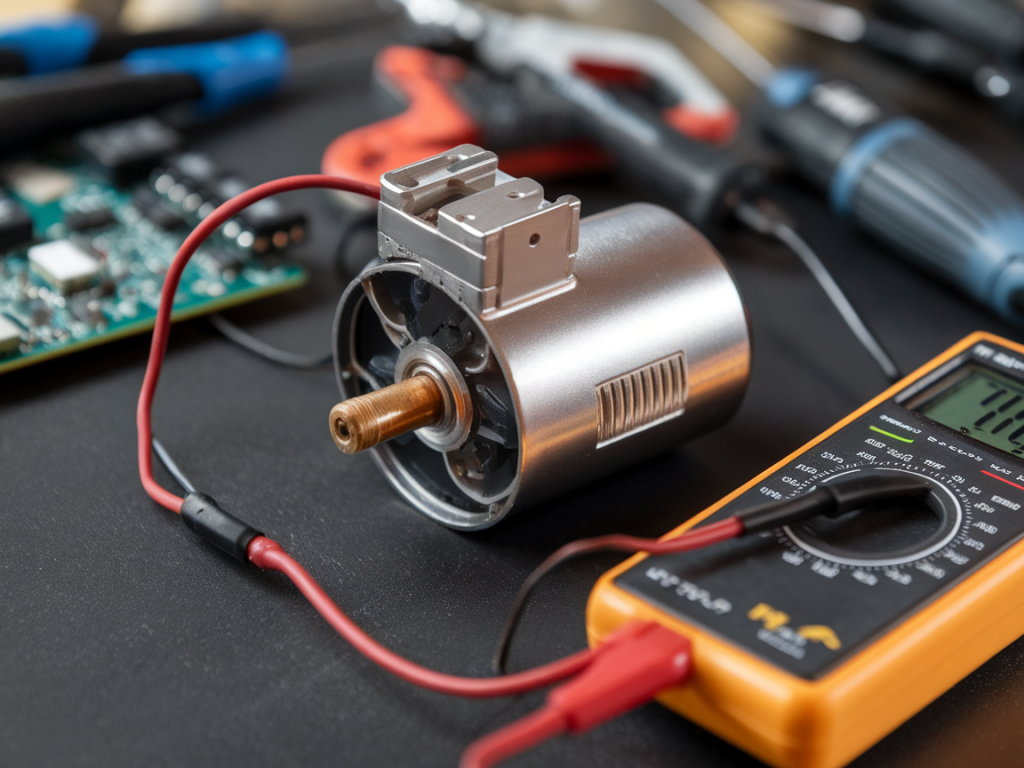
    I recommend MEMS accelerometers (±16 g range) or piezoelectric sensors for higher-frequency needs. Choose tri-axial sensors near the motor bearing housing for vibration. Mounting matters: use a solid mechanical bond (stud mount if possible) — tape mounts skew high-frequency content.

    For current, split-core CTs are simple to retrofit on existing wiring; Rogowski coils are excellent when you need wide bandwidth and safety on high-current lines. Place current sensors on the motor supply phase(s) near the motor feed to minimize noise from other loads.

    Data acquisition and sampling guidelines

    Sampling rates determine what faults you can detect:

  • Vibration: 5–20 kHz for detailed bearing and gear analysis; 1–5 kHz can be adequate for general envelope analysis on slower machines.
  • Current: 2–10 kHz to capture supply harmonics and transient events; lower rates (~1 kHz) may still detect slow load changes but miss higher-order harmonics linked to rotor faults.
  • Use synchronized timestamps for both channels. I’ve seen false diagnostics when vibration and current data were offset by seconds — synchronization makes cross-signal features interpretable (for example, correlating torque pulses with impact events).

    Feature extraction that works in the plant

    Raw waveforms are heavy. Extract features at the edge for bandwidth efficiency. Here are features I use routinely:

  • Time-domain (vibration): RMS, kurtosis, crest factor, peak-to-peak, skewness.
  • Time-domain (current): RMS current, inrush amplitude, torque ripple proxies (from phase currents), envelope statistics.
  • Frequency-domain (vibration): FFT bands, bearing fault frequencies (BPFO/BPFI), gear mesh frequency, and harmonics.
  • Frequency-domain (current): supply harmonics, sidebands around supply frequency (indicative of rotor bar issues), and motor slip frequency components.
  • Cross-domain: correlation between vibration envelope peaks and current spikes, event-aligned averages.
  • Simple, interpretable features are better than opaque deep models for first deployments. They’re easier to validate with maintenance teams and debug when something goes wrong.

    Analytics strategy: rules, baseline + anomaly, and models

    I recommend a layered approach:

  • Baseline and alarm rules: define normal operating envelopes per machine state. Use percentiles (e.g., 95th) instead of fixed thresholds when load varies.
  • Anomaly detection: unsupervised methods (e.g., isolation forest, autoencoders) to detect deviations from baseline. Run these at the edge to get immediate alerts.
  • Supervised models: useful once you have labeled failure data. They can predict remaining useful life (RUL) for recurring failure modes like bearing wear.
  • Start with rules and baseline to get quick wins, then add anomaly detectors. Supervised models are powerful but require a dataset that many plants don’t initially have — don’t wait to get value.

    Integration with maintenance workflows

    Alerts are only valuable if they lead to action. I integrate alerts into the CMMS (e.g., SAP PM, IBM Maximo) or ticketing tools (Jira Service Management, ServiceNow). Each alert should contain:

  • Signal summary (vibration + current stats),
  • A probable root-cause (bearing, misalignment, electrical),
  • Confidence score and recommended action (inspect bearing, check encoder, verify drive parameters),
  • Suggested urgency based on production impact and redundancy.
  • Involving maintenance technicians early is critical. I run joint workshops where we review real alerts, inspect the machine, and refine alarm rules together. That builds trust and improves triage time.

    Validation and tuning on the shop floor

    Don’t expect perfection at launch. I follow a 3-phase rollout:

  • Pilot: pick representative critical machines, instrument them thoroughly, and run parallel diagnostics for 3–6 months.
  • Refinement: adjust thresholds, add contextual features (speed, load, temperature), and label events.
  • Scale: expand to fleet using lessons learned and automated provisioning templates.
  • Key metrics to track: detection lead time (days between alert and failure), false positive rate, and technician time per alert. Aim for an acceptable tradeoff — a small increase in false positives can be worth a large increase in lead time if it prevents unplanned downtime.

    Typical pitfalls and how to avoid them

  • Over-sensitivity: too many nuisance alerts. Fix by incorporating operational state (idle/run) and variable load into thresholds.
  • Poor synchronization: misaligned timestamps. Use NTP/PPS or hardware triggers when possible.
  • Ignoring context: a gear mesh vibration signature during a speed ramp isn’t a fault. Capture machine state and production schedule for context.
  • Data overload: storing raw waveforms for every machine is costly. Store processed features and waveforms sampled on event or rolling buffer.
  • Tools and vendors I’ve used

    I’ve deployed systems using accelerometers from PCB Piezotronics and TE Connectivity for higher-end use, and MEMS units from Analog Devices for mass rollouts. For current sensing, YOKOGAWA’s Rogowski coils and LEM split-core CTs are reliable in my experience. On the software side, edge gateways from Hilscher and Moxa work well; cloud analytics using AWS IoT or Azure Digital Twins give good scaling. Open-source projects like Scipy for processing and InfluxDB + Grafana for visualization are a practical combo for pilots.

    Final operational tips

  • Document the maintenance playbook for each alert type — technicians should know what to inspect and how to verify the root cause.
  • Plan spare parts and lead times based on predicted failures — RUL estimates can drive inventory optimization.
  • Keep a feedback loop: capture technician outcomes to improve models and reduce false positives.
  • Start small, iterate fast. Early wins build the credibility you need to scale predictive maintenance across the plant.
  • If you want, I can share a template for sensor placement and a sample feature extraction pipeline (Python snippets) that I use during pilots. Drop me a note and tell me the motor sizes, drive types, and whether you’re working with standard AC servos or more specialized brushless/torque motors — I’ll tailor the template to your needs.


    You should also check the following news:

    Process Optimization

    operator‑centric hmi redesign: reducing training time and human errors in high‑mix lines

    02/12/2025

    I’ve spent the last decade redesigning operator interfaces on high‑mix production lines, and one lesson keeps coming back: the best HMI is the...

    Read more...
    operator‑centric hmi redesign: reducing training time and human errors in high‑mix lines
    Smart Factory

    how to use transfer learning to speed up defect detection on new product variants

    02/12/2025

    When a new product variant appears on the line — a different connector, an altered label layout, or a slightly changed surface finish — the...

    Read more...
    how to use transfer learning to speed up defect detection on new product variants